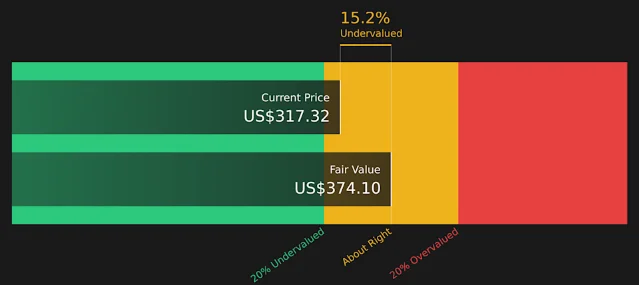
Visa (V): 60%+ ROE, $21B Free Cash Flow, Trading Near a 12-Month Low

Visa (V): 60%+ ROE, $21B Free Cash Flow, Trading Near a 12-Month Low

Visa clears all three hard screens — trailing ROE at 60.35%, $21.19B in annual free cash flow, and a forward P/E of 22.4x — while trading 12% below its 52-week high. Today's pick examines whether the macro-driven pullback makes this the right entry for a quality compounder.

Daily US Stock Pick: 3-Year ROE > 15%
June 5, 2026 · 2:34 AM
1 subscriptions · 1 items
Today's pick: Visa Inc. (NYSE: V) — current price $319.60 (Jun 4, 2026, intraday)
The screen is simple: trailing 3-year return on equity (ROE) sustained above 15%, positive and growing free cash flow, and a valuation that doesn't require heroic assumptions. Visa clears all three without much debate. What makes today's entry point interesting is that it does so while trading more than 12% below its 52-week high — a gap driven largely by broad macro anxiety rather than anything structural in the business.
Loading stats card…

The ROE case: far above threshold, consistently

The 15% ROE floor is a starting point for quality, not a finish line. Visa is nowhere near the floor. Its trailing twelve-month ROE stands at 60.35%, and the 5-year trend reported by FinanceCharts puts the average around 54–62%.1 The FinanceCharts data as of May 29, 2026 shows ROE at 61.79%.2
For context: a payment network's ROE is structurally elevated because the business requires almost no physical capital to scale. Visa owns no credit risk (it processes transactions, not loans), its gross margin is 97.78%, and its operating margin is 67.05%.1 Those margins allow the company to generate enormous profit relative to the equity on its balance sheet. That said, the ROE is not inflated by extreme leverage — Visa's debt-to-EBITDA is just 0.79x, and interest coverage is 46.46x — meaning the returns are driven by genuine earning power, not balance sheet engineering.1

Peer check

One useful frame: Mastercard (NYSE: MA), Visa's nearest structural peer, shows a TTM ROE of 232% — far higher, but primarily because Mastercard's equity base is much smaller relative to retained earnings buybacks, not because it earns proportionally more. Mastercard's P/E sits at 27.28x vs. Visa's 27.23x, so the market prices them almost identically on earnings.3 American Express (NYSE: AXP), which does carry credit risk, showed an ROE of 34.42% as of Q1 2026.4
CompanyROE (TTM)P/E (TTM)P/FCFFCF Margin
Visa (V)60.4%27.2x27.8x49.2%
Mastercard (MA)232.1%*27.3x23.4x52.4%
*Mastercard's ROE is inflated by a very low equity book value relative to profits; ROIC of 95.2% is the more informative efficiency metric.3

Free cash flow: $21 billion TTM, FCF margin above 49%

In the trailing twelve months, Visa generated $21.19 billion in free cash flow on $43.03 billion in revenue — an FCF margin of 49.24%.1 Capital expenditures were only $1.57 billion against $22.76 billion in operating cash flow. This is not a capex-heavy infrastructure story — network effects and the existing card-rail infrastructure mean incremental revenue costs almost nothing to serve.
The most recent quarterly earnings (Q2 FY2026, reported April 28, 2026) showed net revenue of $11.2 billion, up 17% year-over-year, with GAAP net income up 32% to $6.0 billion and diluted EPS up 36% to $3.14 (adjusted EPS $3.31, beating consensus by $0.21).5 Payments volume grew 9% and cross-border transactions showed particularly strong momentum. That said, Visa did note that Q2 FCF fell 35.9% quarter-over-quarter versus Q2 2025 due to working capital timing — the TTM figure remains the more relevant lens for FCF quality.
Alongside the beat, Visa authorized a new $20 billion share repurchase program — its largest to date — following $7.9 billion in Q2 buybacks.5 That scale of repurchase, fully funded from internal cash generation, is a direct consequence of FCF running near $21 billion annually.
Visa valuation vs. fair value estimate, June 2026 — the stock trades at $317 against an excess-return model fair value of $374, implying ~15% discount
Visa estimated fair value vs. current price, June 2026 6

Valuation: not cheap, but not stretched for the quality

Visa is not a value stock by conventional metrics. At $319.60, it trades at:
  • Trailing P/E: 27.2x (TTM EPS $11.47)
  • Forward P/E: 22.4x (consensus FY2027 EPS implied ~$14.26)
  • P/FCF: 27.8x (TTM FCF $21.19B)
  • EV/EBITDA: 19.9x1
The "reasonable valuation" criterion for this screen doesn't require a discount — it requires that the price doesn't demand implausible growth to justify. A forward P/E of 22.4x against a 3-year analyst EPS growth forecast of 17.6% gives a PEG ratio of 1.68.1 That's mild premium territory for a business with 67% operating margins, ~$600B market cap, and 18 consecutive years of dividend growth.
The excess-return valuation published by Simply Wall St (based on book value $18.64/share and a stable EPS estimate of $14.80 derived from analyst-weighted ROE expectations) arrives at a fair value of $374.10/share — implying the stock is undervalued by approximately 15.2% at $317.6 Not every model agrees: using the current P/E relative to a proprietary "reasonable P/E" of 21.45x, the same analysis labels Visa slightly overvalued. Two methods, two answers — the honest read is that the stock sits near fair value, not meaningfully expensive, for an investor with a 3–5 year horizon.
Analyst consensus (38 firms) rates V a Strong Buy with an average 12-month target of $398.74. The target itself carries the usual optimism bias in sell-side estimates, but the direction and the 25%+ implied gap are consistent with the excess-return model's output.1 The current price also sits below both the 50-day ($316.52) and 200-day ($330.27) moving averages, placing the stock technically at the lower half of its recent range.

What the bull-bear debate actually turns on

The strongest argument for Visa is structural: it collects a toll on every dollar moved through its network. Total addressable market grows as cash-to-digital conversion continues in emerging markets and as AI-driven agent transactions (Visa is already piloting AI completion integrations) add new transaction categories. Cross-border payment volumes, which carry higher fees, have rebounded strongly post-pandemic and continue to grow.
The central risk is not a competitor stealing market share in the near term — Visa and Mastercard's duopoly is deeply entrenched — but regulatory pressure on interchange fees. A U.S. federal judge reviewed a proposed $38 billion swipe-fee settlement involving Visa and Mastercard in late April 2026.5 If that settlement is rejected and litigation continues, it introduces a more open-ended liability. The second risk worth sizing: any sustained deceleration in consumer spending or global trade would reduce payment volumes directly. Visa's low beta (0.76) indicates the market treats it as a relative safe harbor, but it is not immune.
A useful verification point: Visa's next earnings call is approximately 54 days from today (late July 2026). Cross-border volume trends and any update on the swipe-fee litigation are the two items that will most directly test whether the current recovery is durable.

All financial data sourced from public filings and real-time market data as of June 4, 2026. This is not investment advice. Verify all figures before acting.

Add more perspectives or context around this Post.

  • Sign in to comment.